Research library Testing Methods
Analytical methods
What Does HPLC Purity Mean on a Peptide Certificate of Analysis?
Article
Testing Methods · 6 MIN READ · DOCUMENTATION
01 / Overview
Start with what purity measures
HPLC purity is reported as the relative area of the main peak under a stated method. It is not a certificate of identity on its own, and it is not a statement of how much peptide is in the vial. Reading the figure correctly means reading three things together: the number, the method printed beside it, and the trace it was calculated from.
What the percentage is
In reversed-phase HPLC a dissolved sample is carried through a column, and its components leave the column at different times. A detector records each as a peak. Purity is the area of the main peak divided by the total area of all peaks, expressed as a percentage. A value of 99.0 percent means that, of everything the detector registered under those conditions, 99.0 percent eluted as the main peak.
Read the method first
Column, gradient, detection wavelength and integration rules all change how side peaks appear [1]. A clean chromatogram under one method can look different under another without the material changing. Peptide bonds absorb strongly near 214 to 220 nanometers, which is why most peptide methods detect there; a method run at a different wavelength sees a different picture. A purity figure printed without its method cannot be compared with any other purity figure.
Wavelength is worth a second look because it changes what is visible at all. At 214 nanometers every peptide bond absorbs, so peptide-related impurities register in rough proportion to their size. At 280 nanometers only tryptophan and tyrosine absorb appreciably - a sequence without them is nearly invisible there, and so are many of its impurities. A high purity figure at 280 nanometers for a peptide with no aromatic residues is not better evidence; it is a measurement taken where little can be seen.
Look at the trace
The chromatogram itself shows what the single number hides: whether the main peak is symmetrical or carries a shoulder, whether the baseline is flat, and whether small peaks were included in the calculation or left out. Two reports can state the same percentage and show very different traces.
The integration table under the trace rewards thirty seconds of attention. Each listed peak carries a retention time and an area percentage, and the percentages should sum to about one hundred, with the main peak's figure matching the headline number. Signs of motivated integration include side peaks visible on the trace but absent from the table, an integration window that starts conveniently after an early peak, or a baseline drawn to shave a shoulder into the main peak. None of these require fraud - integration rules genuinely involve judgment [2] - which is exactly why the trace and table belong with the number.
What a shoulder or a split peak suggests
A shoulder on the main peak often indicates a closely related species - a deletion sequence missing one residue, an oxidized variant, or an aggregate - eluting almost together with the target. Chromatography that resolves such species into a visible shoulder is doing its job; a method that smears them into one smooth peak reports a higher number while saying less. This is why identical percentages from different methods are not identical evidence, and why the identity question belongs to mass spectrometry rather than to the chromatogram.
What the figure does not cover
Purity describes the peptide fraction only. It does not confirm which molecule produced the main peak, which is the job of mass spectrometry. It does not account for water and counterions, which do not appear as peaks but are part of the weight in the vial. And it does not detect contaminants that do not absorb at the detection wavelength. Analytical guidance treats specificity, the demonstration that a method measures what it claims to measure, as a property to be established rather than assumed [2].
On a FLASK batch record
On a FLASK batch record, HPLC purity is listed next to the lot number, the method and the laboratory that ran it. Peptide content (mg per vial) is a reserved field - shown when the report includes that assay, otherwise recorded as a dash.
Frequently asked questions
Does 99 percent HPLC purity mean the vial is 99 percent peptide?
No. Purity describes the peptide fraction only. Water and counterions do not appear as peaks and are part of the weight in the vial, so the mass of peptide is given by net peptide content, not purity.
Can purity figures from two laboratories be compared?
Only when the method is the same. Column, gradient, detection wavelength and integration rules all change how side peaks appear, so a purity figure printed without its method cannot be compared with any other.
What does HPLC purity not show?
It does not confirm which molecule produced the main peak, which is the job of mass spectrometry, and it does not detect contaminants that do not absorb at the detection wavelength.
What should the integration table show?
Every visible peak, each with retention time and area, summing to about one hundred percent, with the main peak matching the headline figure. Peaks visible on the trace but missing from the table are a question to ask.
Is a purity figure at 280 nanometers meaningful?
Only for sequences containing tryptophan or tyrosine. For peptides without aromatic residues, detection near 214 to 220 nanometers is where the molecule and its impurities are actually visible.
Figure
Read the chromatogram
The headline percentage is only as useful as the trace behind it. Review peak shape, baseline, and whether side peaks are integrated under the same rules.
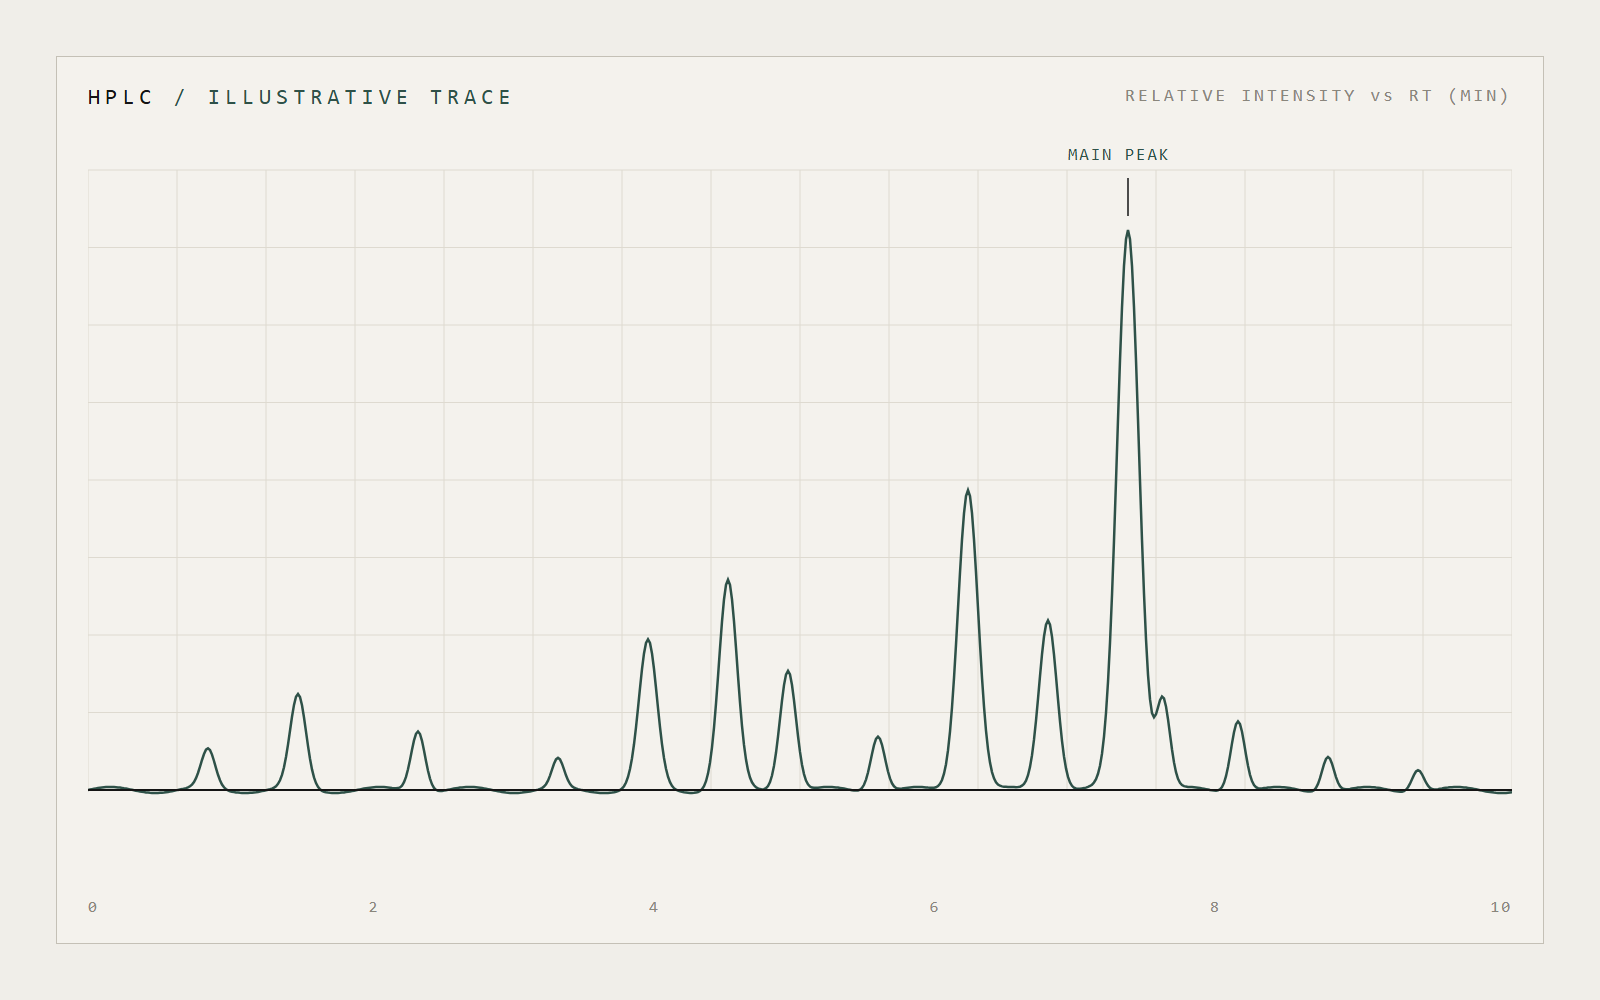
Illustrative analytical trace
What to review
- Purity Main peak area under the stated method.
- Identity Orthogonal MS result when reported.
- Peptide content Mass per vial when reported (mg / vial).
Footnotes & references
References
- USP-NF General Chapter 621 Chromatography.
- U.S. FDA. Analytical Procedures and Methods Validation for Drugs and Biologics - Guidance for Industry. July 2015.
Related products & records
Read the specification and the record
Use the lot record and testing pages for the source analytical documentation.
Related reading